Energy outpaced September’s entire goods-spending increase
BEA’s new report shows energy added more than the net gain in consumer goods spending. The split calls for separate fuel and merchandise demand checks.


BEA’s new report shows energy added more than the net gain in consumer goods spending. The split calls for separate fuel and merchandise demand checks.

Equipment and technology categories added more than the entire net increase in import dollars. New Census data reverse August’s industrial-supplies signal and strengthen the case for a more selective freight outlook.

New Census tables show a sharp aircraft booking increase inside a stronger factory headline. Machinery shipments also advanced, giving industrial carriers a more specific demand signal to test.

ATA’s truck-tonnage reading and Cass’s shipment count both improved in September. Their different coverage, timing and price measures explain why the gains do not translate into one nationwide rate signal.

Delivery, railcar placement and truck loading are different milestones. This resource explains how the current rail-service measures can help test a transload quote without treating an aggregate score as a pickup promise.

The latest EIA report shows more distillate nationally, but the low-sulfur fuel pool moved in opposite directions across regions. That changes how fleets should read the apparent replenishment.

A two-month fuel-price lag changes the fall grain cost comparison. Truck carriers and shippers should match the service month and surcharge authority before comparing modes.

CBP’s voluntary test starts October 23 with two filing deadlines. For participating carriers, the commercial question is whether shipment information can arrive before equipment is committed.

A USDA waterways study shows why grain haulers should test the assumptions behind a modal shift before treating displaced barge tonnage as available truck freight.

September authorizations for single-family homes fell 4%. For material haulers, the new Census report calls for a project-mix check, with caution around the less certain starts estimate.

BTS has added 2025 truck movements to its experimental database. Its county-boundary clock can help test a lane assumption, but it leaves part of the customer-to-customer trip outside the measurement.

Durable manufacturing rose at a 3.8% annual rate while nondurables contracted. The Federal Reserve’s new quarterly split asks industrial carriers to test how much of that growth fits their freight book.

Import airfreight prices edged higher while inbound prices fell. The new BLS table gives airport trucking teams a reason to check which market a benchmark actually measures.

About 71% of the monthly increase came from gasoline-station receipts. Carriers need a separate test of replenishment demand before reading stronger retail dollars as more freight.

The latest BTS report puts trucking, both rail categories and waterborne freight on the declining side. The market question is how much volume a carrier can count on when renewing business.

BTS offers a faster modeled view of cross-border activity. This resource explains what belongs in a carrier’s planning sheet before an early signal becomes a truck commitment.

New Census sector tables put electrical equipment at the center of the monthly dollar increase. The mix gives carriers a better customer question than the national growth rate alone.

USDA’s October 8 assessment pairs a small national cushion with deficits in 18 states. For harvest fleets, the unanswered question is where grain can be received and moved next.

The full August trade report shows $5.5 billion of combined gains in gold, crude oil and fuel oil against a $4.2 billion Census-basis goods-export increase. Export-facing fleets need the product mix behind the rebound.
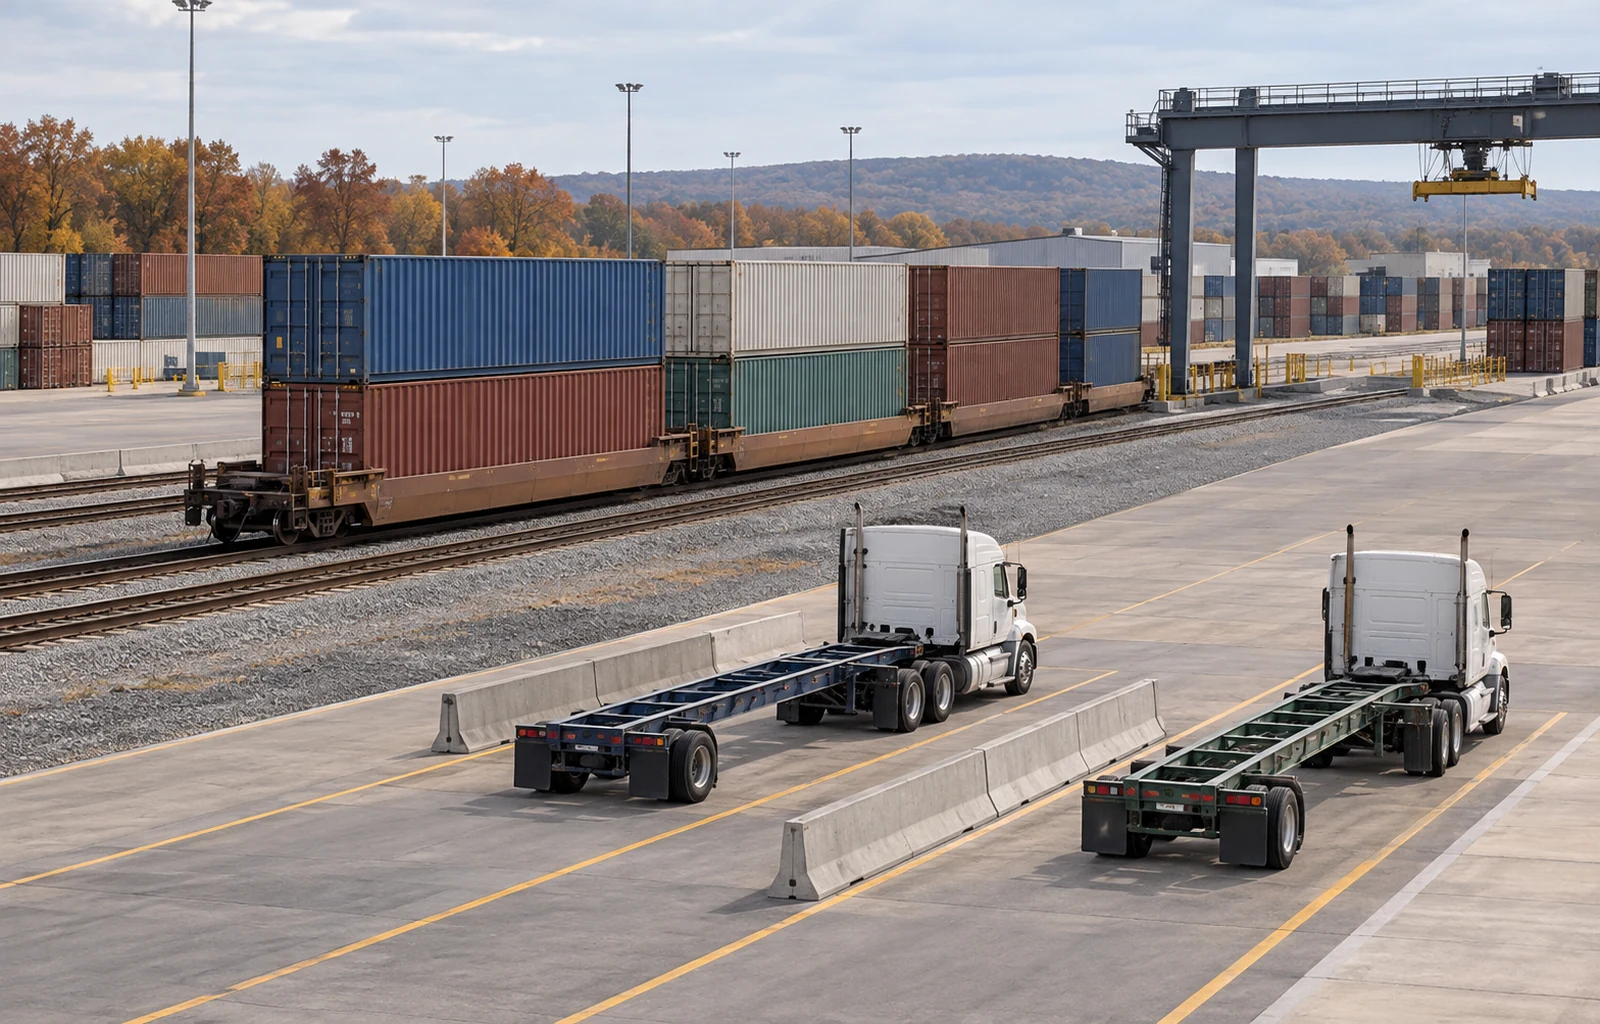
AAR’s latest intermodal gains range from 0.7% in its Canadian group to 36.7% in its Mexican group. The reporting footnotes explain why that split cannot measure traffic through a particular border gateway.

EIA’s October outlook puts winter distillate stocks 20% to 30% below normal in a region that depends on Gulf Coast deliveries and seasonal imports. The supply route matters to fleets buying fuel across several regions.

FMCSA’s October 5 final rule changes the regional time limit from 14 days to 30. Direct assistance and the earlier end of the emergency still control when a movement qualifies.

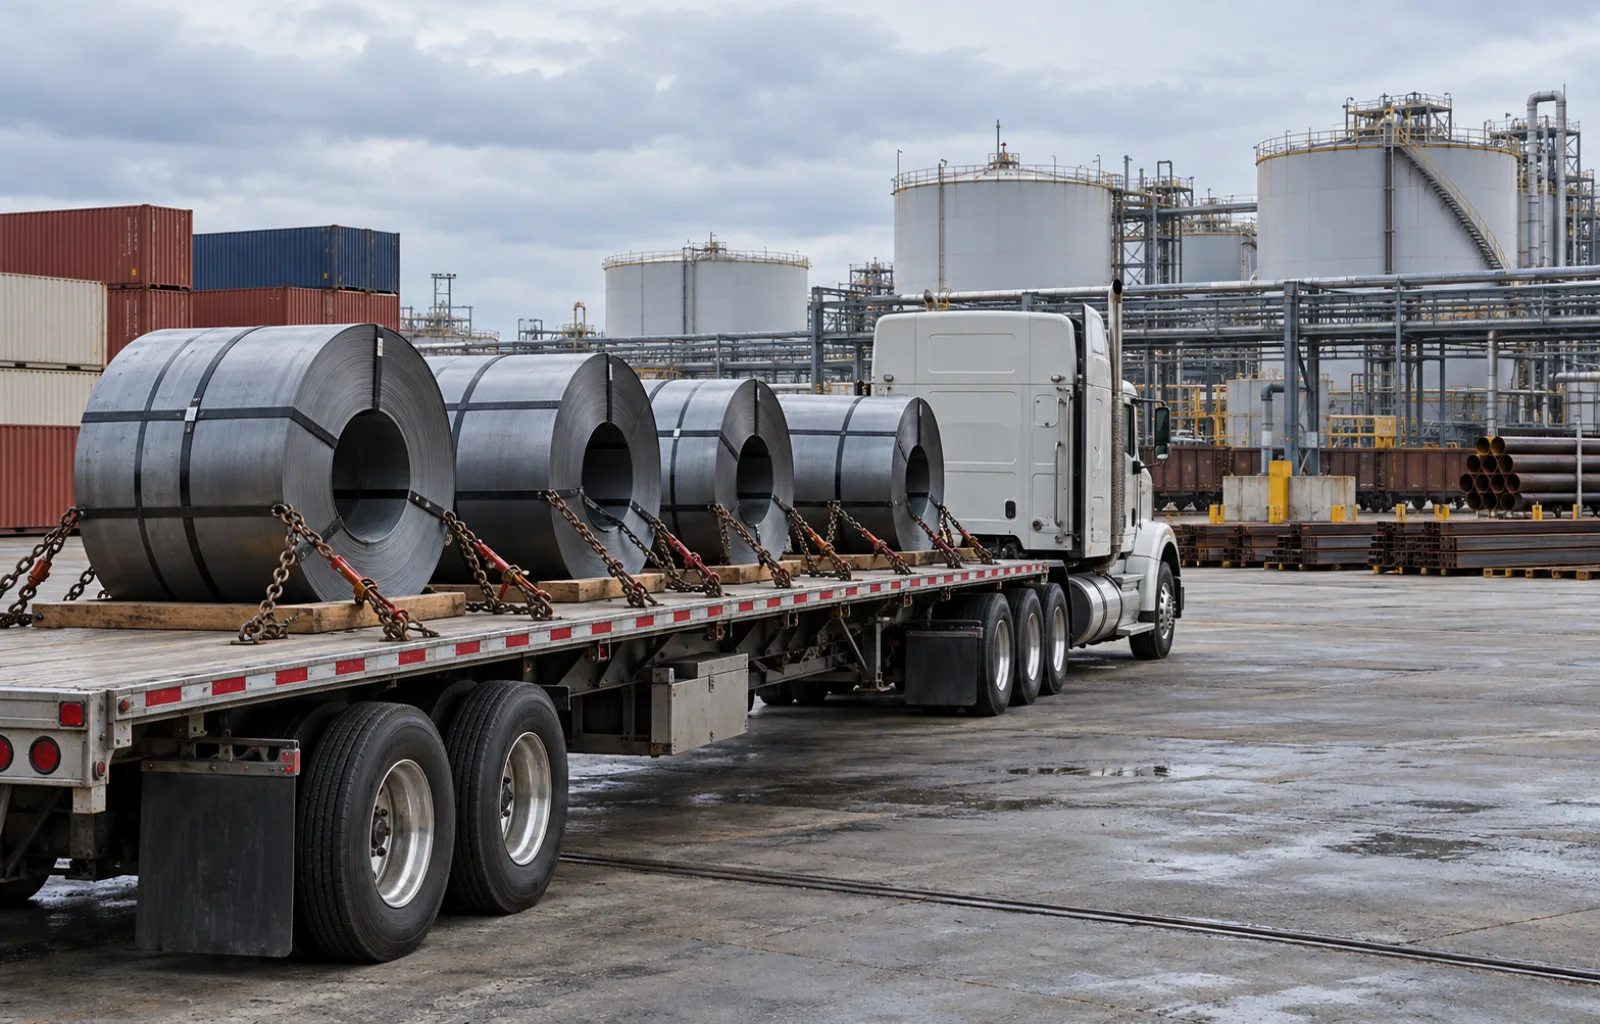
August steel imports rose 3.4% in physical tons, but hot-rolled sheets, slabs and cut plate added more than the entire net gain. The commodity split matters more to heavy-haul planning than the rounded national total.

BTS found older tank cars in 2025 activity, but its annual method cannot place those moves before or after the May 1 deadline. Bulk-liquid planners need to separate fleet progress, cargo-specific eligibility and actual replacement capacity.

Vehicle and parts dealers supplied about 88% of the monthly increase in retail inventory dollars. Outside that group, the advance estimate was nearly flat—and a revised July baseline changes the comparison.

New per-car corn charges took effect October 1. Grain shippers comparing truck and rail options need to keep the tariff, fuel charge and cost of railcar access on their own terms.

September’s federal payroll report puts truck transportation up 2,600 jobs and warehousing down 4,100. The split points freight planners toward the receiving handoff, rather than a single national capacity verdict.

Census’s full August report shows petroleum and coal products supplied more than the net increase in nondurable shipment dollars. Outside that category, the aggregate was essentially flat—a narrower market signal than the headline gain.

Census’s new August estimates put private office construction up 4.6% for the month and private manufacturing construction down 19.8% from a year earlier. The split gives material-hauling fleets a sharper customer question than the national spending total.

EIA’s September 30 report shows a 2.3-million-barrel national distillate draw, led by the Midwest, alongside stronger four-week supplied volume. The regional refinery and stock figures sharpen the fleet fuel-supply check.

BLS estimates 338,000 openings but 247,000 hires across transportation, warehousing and utilities. The divergence asks whether approved positions are turning into starts, rather than proving a new truck-driver shortage.

Goods supplied nearly 60% of August’s consumer-spending increase, while real overall consumption rose 0.6%. BEA’s annual update makes the current July comparison essential for freight planning.
U.S. goods imports rose 5.5%, led by industrial supplies and capital goods. Consumer-goods imports declined, narrowing the case for treating the new trade total as a broad retail freight surge.

Pacific Northwest corn inspections reached a record for their September week, but rail signals diverged. Grain fleets need confirmed origin work, not a port total converted into truckloads.

The Federal Reserve's U.S. assembly rate fell from July, but an annualized factory measure cannot tell a fleet how many tractors reached customers or when its order will arrive.

BTS reports a 23.9% rise in cross-border truck freight value, yet inbound trucks from Mexico were nearly unchanged and entries from Canada fell. The two measures ask different capacity questions.

A fresh Census report separates a softer August shipping handoff from orders still waiting on factory floors; the transportation category drove the monthly shipment decline.

EIA's new annual report puts renewable diesel and other biofuels capacity at 324,000 barrels per day. Most sits in the Gulf and West Coast regions, and capacity is not production or delivered fleet supply.

Total business inventories rose 0.8% while sales increased 0.3%. Retail and wholesale coverage edged higher, but the rounded national ratio remained below July 2025.

BLS says August import prices rose 0.7%, led by nonfuel goods, while inbound air-freight prices gained 1.8%. The indexes flag broader cost pressure but do not measure load count, duty, or domestic truck rates.

The agency raised its fourth-quarter retail forecast to $5.55 and expects diesel crack spreads above $2 through November. The 2027 decline is gradual and depends on normalized Middle East tanker flows.

A September 15 tariff-table change adds Canadian cheese, paper, metals, furniture and selected vehicles to a 50% duty while removing salt, cement and other goods. A separate motorcycle import ban starts September 29.

Commerce opened antidumping investigations covering five countries and subsidy investigations covering three. The written scope reaches cylinders and attached components, but initiation alone does not impose a new fleet-parts duty.

USDA counted 86.0 million metric tons of corn exported in 2025/26, up 25%, while 15.6 million tons of sales moved into the new marketing year. The handoff separates completed freight from the book still waiting to move.

A new U.S. maritime advisory keeps attack and navigation risk high in the Persian Gulf, Strait of Hormuz and Gulf of Oman. The inland freight response begins with a confirmed vessel and voyage change, not a blanket delay assumption.

The Port of Los Angeles moved more than 2.9 million TEUs from June through August, its busiest three-month stretch. But August imports were nearly flat from last year, separating sustained gateway workload from a new demand acceleration.

BTS counted 1,293 fewer cargo-airline employees in July while FedEx alone was down 1,448. The concentrated change is relevant to a major national network, but employment data cannot establish a service or lift reduction.

BLS's truck-freight commodity index rose 2.0% from July while water freight and cargo-arrangement measures were essentially flat. The divergence is a warning against carrying one modal price signal across an entire freight budget.

AAR's 13.8% year-over-year gain compared a full pre-holiday week in 2026 with a 2025 week that contained Labor Day. Current volume was actually 1.8% below the preceding week, making the calendar—not a sudden surge—the first fact to check.

BTS now puts July's Freight TSI at 135.7, down 0.7% from June. Its new history also revises June to a 1.0% gain, replacing the three-month slide reported in August with a weaker—but uneven—spring and summer path.