
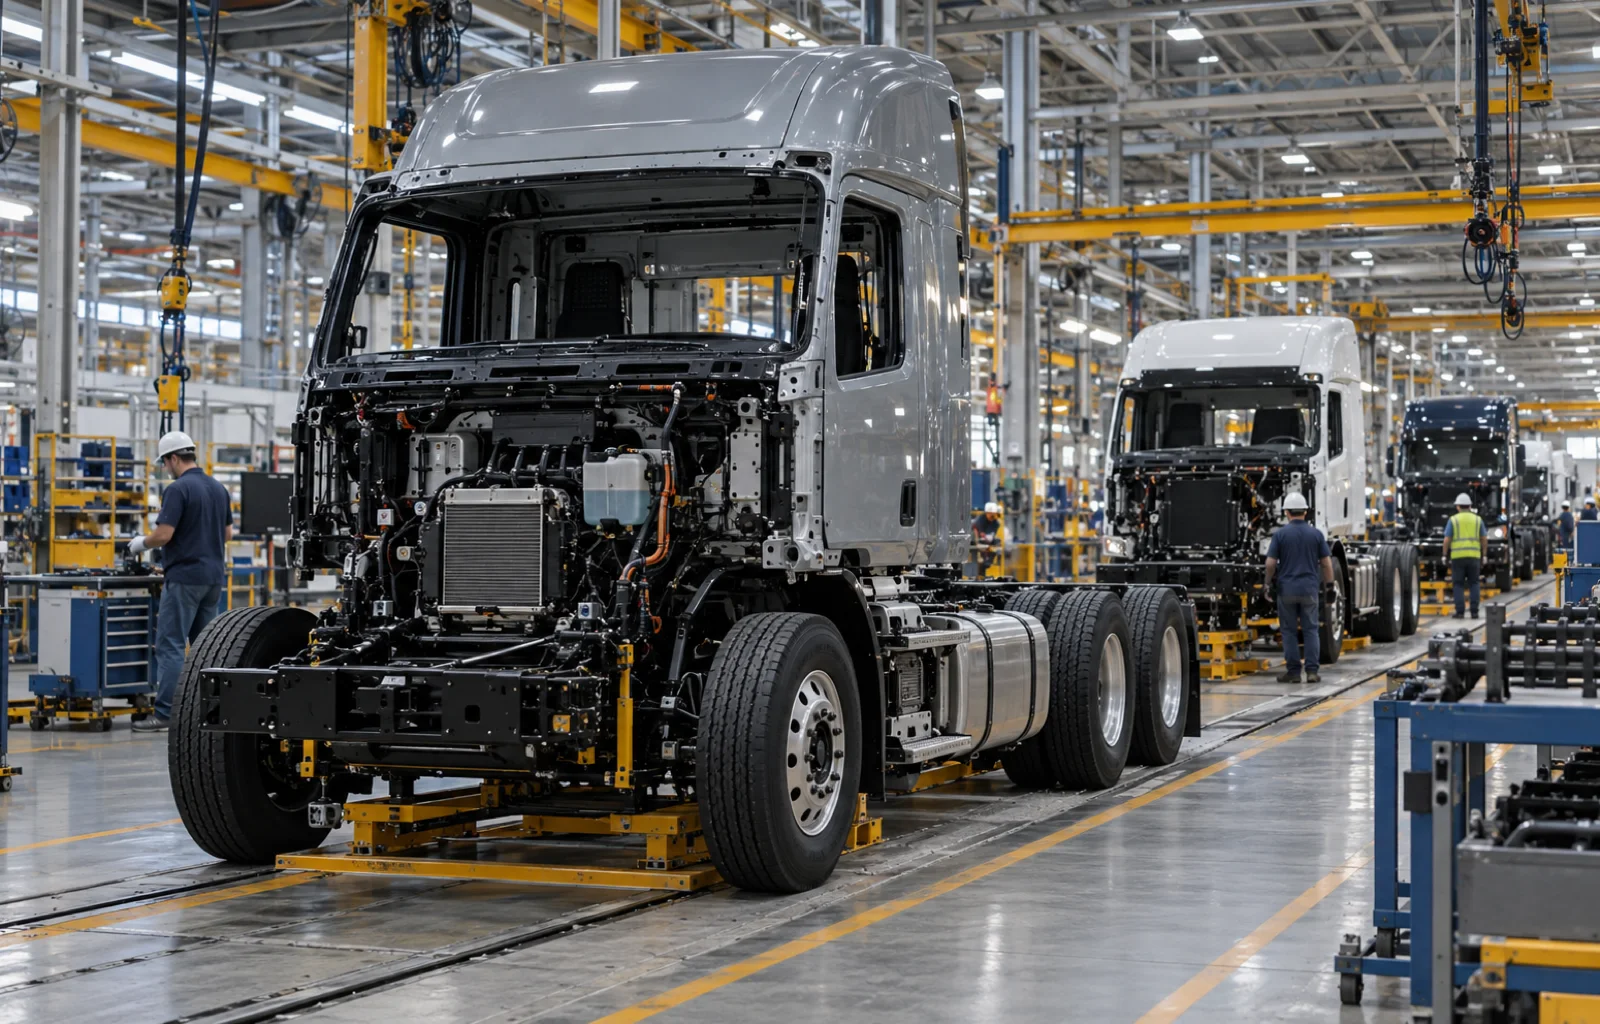
U.S. medium- and heavy-truck assembly lost pace in August after a stronger July, according to the Federal Reserve's September 18 industrial-production release. Its seasonally adjusted annual rate for that group was 0.29 million units, down from 0.33 million in July and 0.32 million in June. The change is a concrete production signal for fleets watching equipment supply, but it is not a count of trucks completed during August.
The distinction is in the unit. The Fed expresses one month's adjusted build pace as the annual rate that would result if that pace continued for a year. Its published figures are rounded to hundredths of a million. Reading the 0.04 million gap as 40,000 fewer vehicles delivered in August would turn an annualized rate difference into a false monthly delivery count. The Fed's seasonal-factor documentation says the adjustment accounts for holidays, month length and normal seasonal variation.
The August rate also needs a longer reference point. Table 3 places the medium- and heavy-truck group at a 0.25 million annual rate on average in 2025, below August's 0.29 million rate. One step down from July therefore does not establish a return to last year's average, let alone a collapse in production. It does show that the July pace was not maintained in the next observation.
The larger truck category can obscure this smaller commercial segment. Total truck assemblies moved from a 9.61 million annual rate in July to 9.29 million in August, while the light-truck component moved from 9.28 million to 9.00 million. Most of the volume in the total is light trucks. A fleet buyer comparing these figures with Class 8 order estimates should use the medium- and heavy-duty row and still remember that the row includes medium-duty vehicles as well as heavy trucks.

 Explore the complete workflow
The broader factory report points in the same monthly direction but answers another question. Manufacturing output fell 0.3% in August after seven consecutive monthly increases, and durable manufacturing output fell 0.5%. Those indexes cover many products besides trucks; they measure real factory output, not a manufacturer's open order slots, finished inventory or delivery performance to carriers.
Census Bureau figures released September 25 add a different lens: transportation-equipment manufacturers shipped $109.5 billion of goods in August, down 1.8% from July. That category includes aircraft and other equipment, and its current-dollar shipment value cannot be converted into a truck count. FreightNews reported the broad shipping and backlog split separately; the Fed's assembly series now supplies the narrower physical build-rate question that the Census dollars cannot answer.
Nor does the Fed series reconcile directly with the preliminary North American Class 8 order estimates FreightNews examined in August. Orders describe purchase commitments in a different geography and vehicle class; this Fed series describes seasonally adjusted U.S. assembly of medium and heavy trucks. An order may wait for a build slot, and a built vehicle may wait for final preparation or delivery. The public series do not identify a particular fleet's place in that sequence.

FreightNews infers that the August dip is a reason to verify delivery assumptions, not a reason to infer a national equipment shortage or surplus. A carrier planning replacement units should ask its supplier for the confirmed production week, specification status, completion milestone and expected handoff date. It should compare those dates with its own maintenance reserve and retirement schedule before assigning revenue work to a truck that has not arrived.
The next monthly assembly reading will show whether August was a one-month pause or the start of a slower build path. Until then, keep three clocks separate in the equipment plan: orders accepted, vehicles assembled and units delivered to the fleet. The Fed currently verifies the middle clock at a national adjusted rate; it does not settle the other two for an individual carrier.