
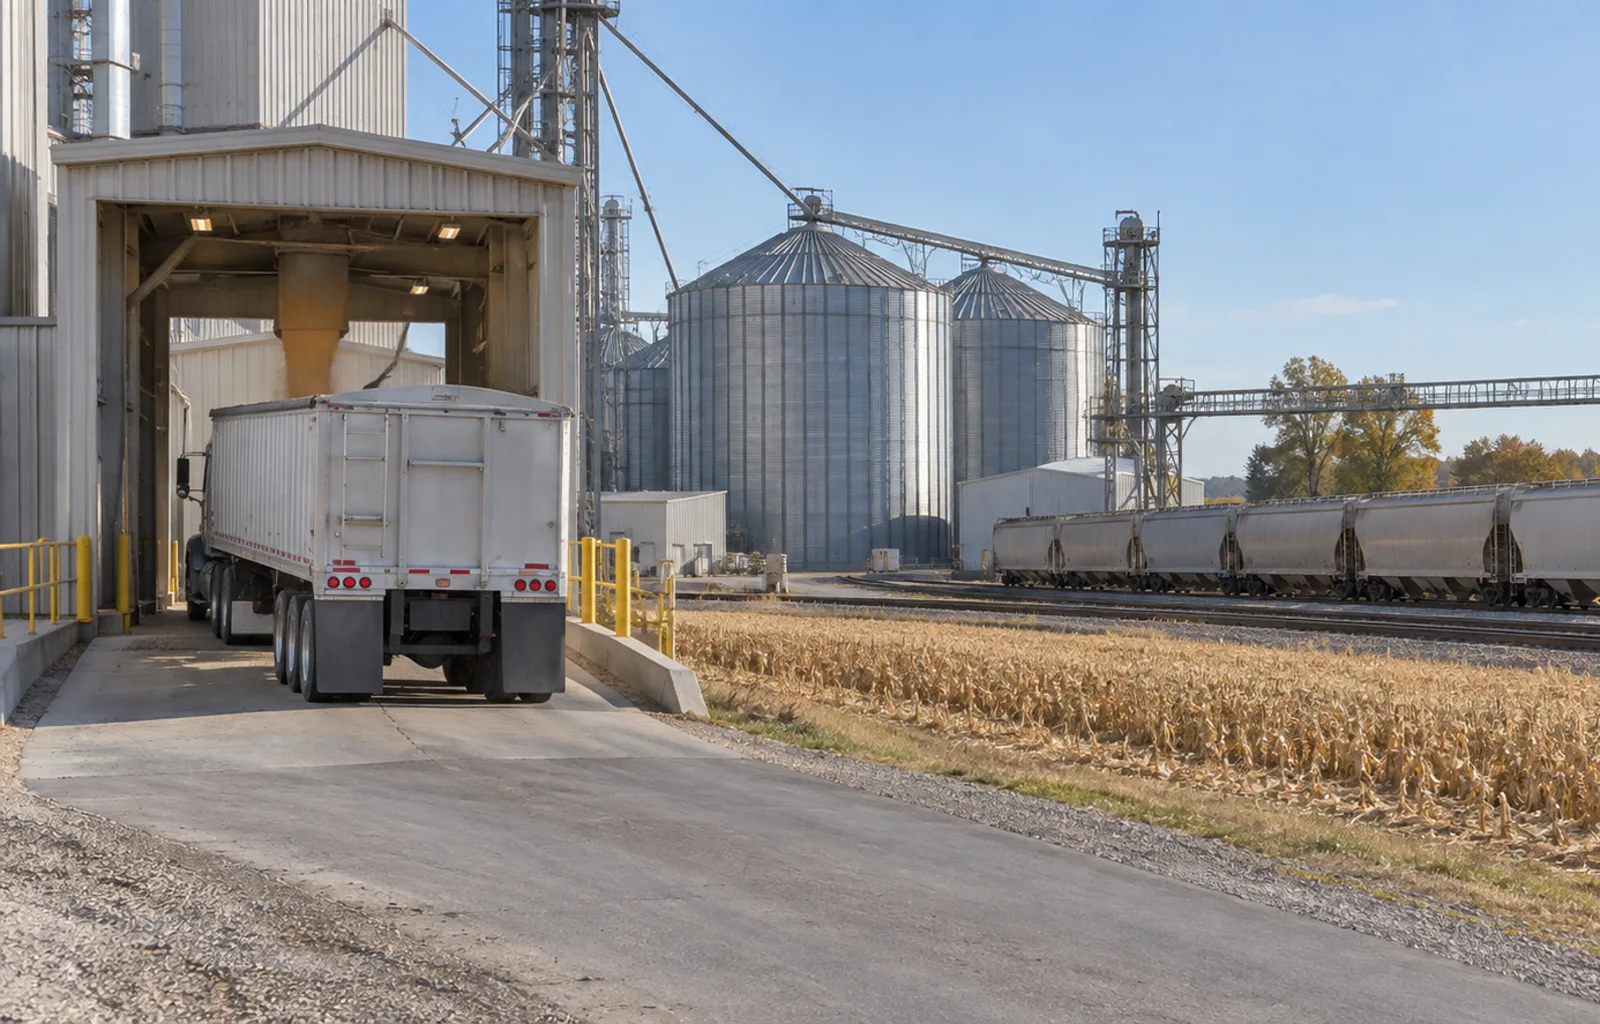

A late-season corn flow through Pacific Northwest export terminals has become a useful test of the harvest freight market. The U.S. Department of Agriculture counted 705,917 metric tons of corn inspected for export there in the week ending September 17, loaded onto 11 ships. USDA called that an all-time record for the corresponding week and the third-largest weekly Pacific Northwest corn total of 2026. It is a measure of grain reaching the export end of a long chain, not a count of truckloads newly available to carriers.
The destinations underscore the scale of the long-haul network: USDA said 80% of that corn was bound for Japan and 20% for South Korea. Grain can move from farms to inland elevators by truck and then travel by rail or barge before vessel loading. The report does not say how many truck trips fed those 11 ships, when those first-mile movements occurred, or which origin counties supplied the cargo. Converting 705,917 metric tons into a spot trucking forecast would erase those gaps.
There is evidence of pressure at another link, though it comes from a different week. USDA reported 28,001 U.S. Class I grain carloads originated in the week ending September 12, 16% above the comparable week of 2025 and 30% above the preceding three-year average. Its September shuttle secondary-market bids and offers averaged $525 per car above tariff in the week ending September 17, $228 higher than a year earlier. The carload figure measures rail originations; the premium describes a market for railcar access, not a trucking rate.
A newer rail reading prevents a straight-line conclusion. The Association of American Railroads reported 21,369 U.S. grain carloads for the week ending September 19, 1,778 fewer than a year earlier. AAR also showed total U.S. rail traffic up 4.9% year over year. The grain and network directions differed. USDA and AAR use separate reporting periods and series, so their grain counts should not be subtracted from one another as though they formed a single weekly trend.

That separation matters to a truck fleet deciding whether to reserve harvest capacity. Pacific Northwest inspections describe cargo at a destination; grain rail originations describe an upstream transport leg; secondary railcar prices describe the cost of securing some future rail capacity. None measures truck tender acceptance, elevator queue time, return loads or the net rate on a carrier’s own lane. A strong port week can coexist with a soft week in a broader rail category, and neither proves truck demand increased everywhere.
USDA’s export-sales snapshot adds another clock. For the week ending September 17, unshipped balances of corn, soybeans and wheat for the 2026/27 marketing year totaled 36.60 million metric tons, 28% above the same point last year but 4% below the prior week. The balance is committed grain awaiting shipment, not a schedule for each pickup. Its mix spans three commodities and many corridors; it cannot be assigned wholesale to Pacific Northwest corn lanes.
FreightNews infers that the most defensible near-term opportunity is selective first-mile and terminal support where an elevator has a dated railcar order, a vessel-linked loading plan or confirmed customer tender. That is an operating hypothesis, not a USDA estimate of additional truck freight. A carrier should ask whether the customer’s appointment, commodity, equipment, origin and delivery window actually match the export chain before adding trucks or repricing a lane.
This is a different question from a season-end tally of corn exports and outstanding sales. The new evidence shows a physical Pacific Northwest shipping week, rail originations, a railcar premium and a subsequent softer national grain-carload comparison. For fall planning, put those public signals beside the fleet ledger: accepted grain tenders, loaded and empty miles, elevator turns, detention, fuel net of recovery, and rail or vessel cutoff dates. The resulting lane-level margin and service record will show where the export pulse became truck work.