
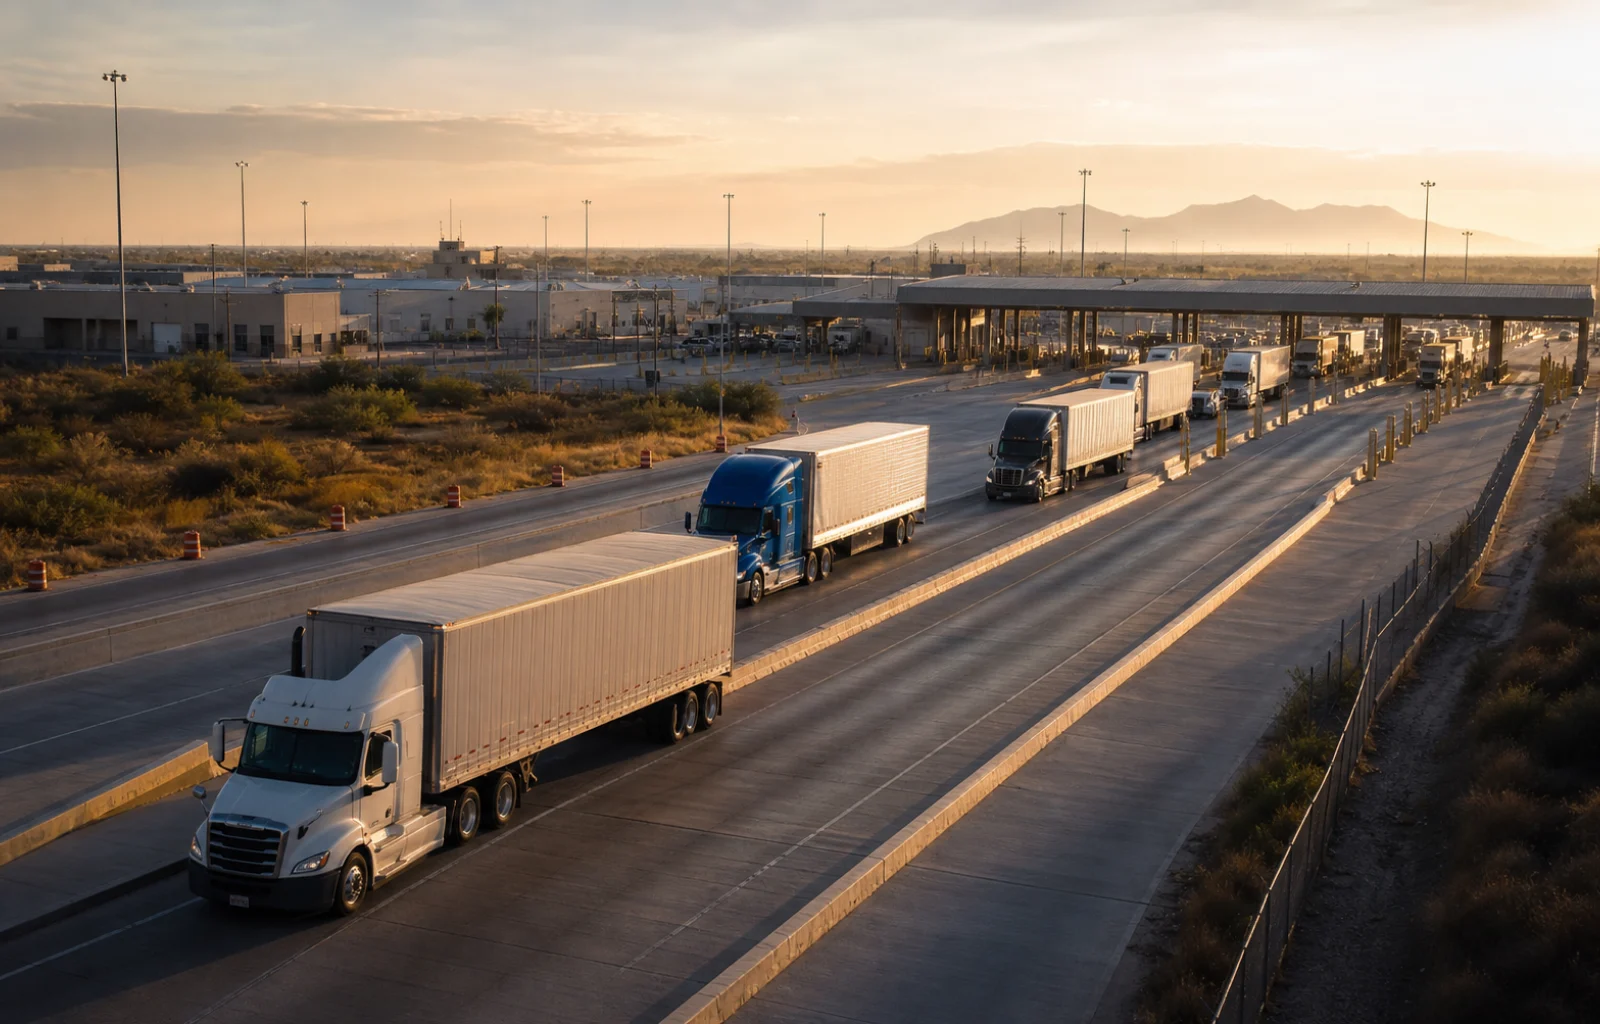
The value of freight moving between the United States and its North American neighbors reached $153.4 billion in May, up 16.1% from May 2025, according to the Bureau of Transportation Statistics. Trucks carried $99.7 billion of that freight, a 15.0% year-over-year increase and by far the largest value of any mode.
Other modes also recorded substantial current-dollar values. Rail moved $17.7 billion, vessels $11.1 billion, pipelines $10.3 billion, and air $7.1 billion. BTS reported year-over-year increases for each of those modes, including 11.1% for rail and 37.7% for vessels.
The two borders were not identical. U.S.-Mexico freight totaled $87.2 billion, up 17.1%, while U.S.-Canada freight totaled $66.1 billion, up 14.8%. Trucks accounted for $64.7 billion on the Mexico border and $35.0 billion on the Canada border.
Those figures establish the scale of the network, not the number of available loads. BTS reports values in current dollars and does not adjust them for inflation. Commodity prices, exchange rates, product mix, and the value packed into each trailer can move the dollar total without producing the same change in truck counts, miles, rates, or carrier utilization.
 See how the work connects
Gateway concentration matters. BTS identified Laredo, El Paso, and Otay Mesa as the leading truck ports for Mexico freight, while Detroit, Port Huron, and Buffalo led truck flows with Canada. A carrier serving those corridors should treat the border crossing as an operating node with its own capacity and failure points, not merely a line between origin and destination.
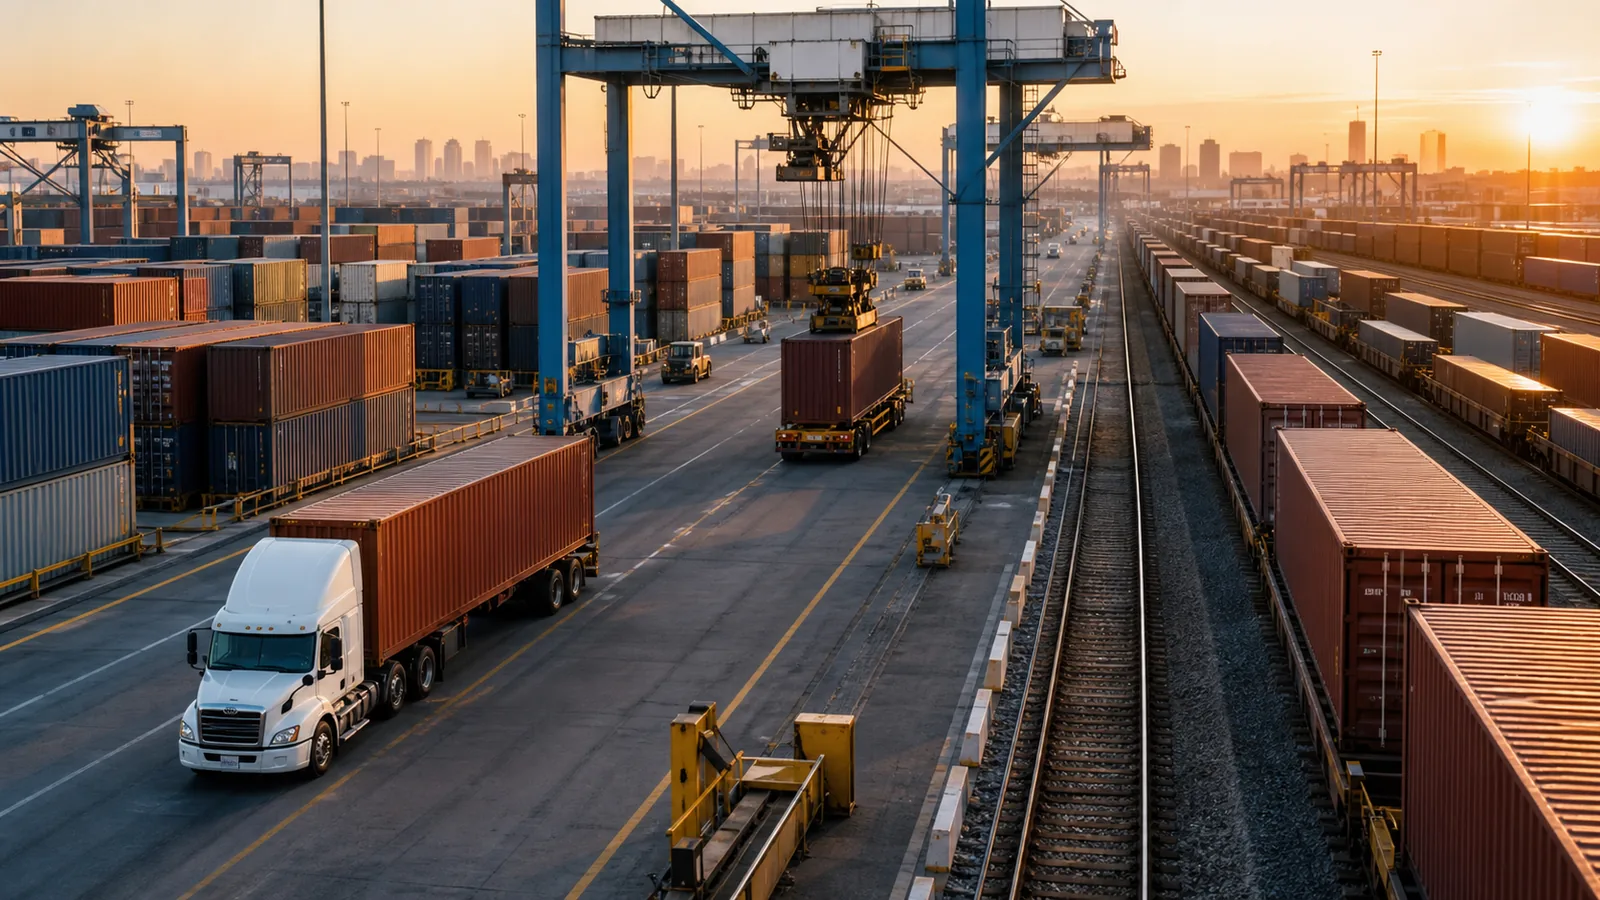
Laredo ranked first among all listed ports by total transborder value at roughly $35.34 billion. Across the full North American dataset, computer-related machinery and parts represented about $33.10 billion, vehicles other than railway equipment about $21.95 billion, and mineral fuels, oils, and waxes about $19.99 billion. Different commodities create different security, documentation, equipment, and timing requirements.
A higher freight value does not automatically create a better carrier result. High-value electronics or vehicle components can increase the headline total while a fleet still absorbs inspection delays, empty repositioning, missed appointments, or an imbalanced return market. Revenue per loaded mile cannot show that entire border turn.
Carriers should separate their Mexico and Canada operating models. Brokerage handoffs, crossing procedures, customer cutoffs, dray arrangements, equipment interchange, and recovery options vary by gateway and account. A single companywide label such as cross-border can hide the corridor where time or cash is actually being lost.

The useful scorecard starts at dispatch. Record arrival at the staging point, document-ready time, inspection or hold time, crossing completion, trailer handoff, empty or bobtail movement, and final appointment performance. Document exceptions should be coded by cause so operations can distinguish a carrier mistake from a broker, customer, agency, or facility delay.
Finance should measure the complete turn as well. Border accessorials, driver time, deadhead, trailer days, yard storage, tolls, and rehandling belong beside line-haul revenue. A strong invoice can still produce a weak tractor day when the network consumes more time than the rate assumed.
Contingency planning is most valuable before a concentrated gateway slows. Identify which alternate crossings are actually usable for the commodity, broker, equipment, customer, and operating authority involved. An alternate route that lacks the right hours, documents, support, or downstream appointment is not a working backup.
May's data confirms that truck freight remains central to North American trade and that the Mexico border carried the larger truck value. The operating opportunity is to convert that scale into reliable turns. Fleets should follow the public value signal with their own evidence on volume, dwell, balance, service, and contribution before adding capacity or promising a new corridor.