

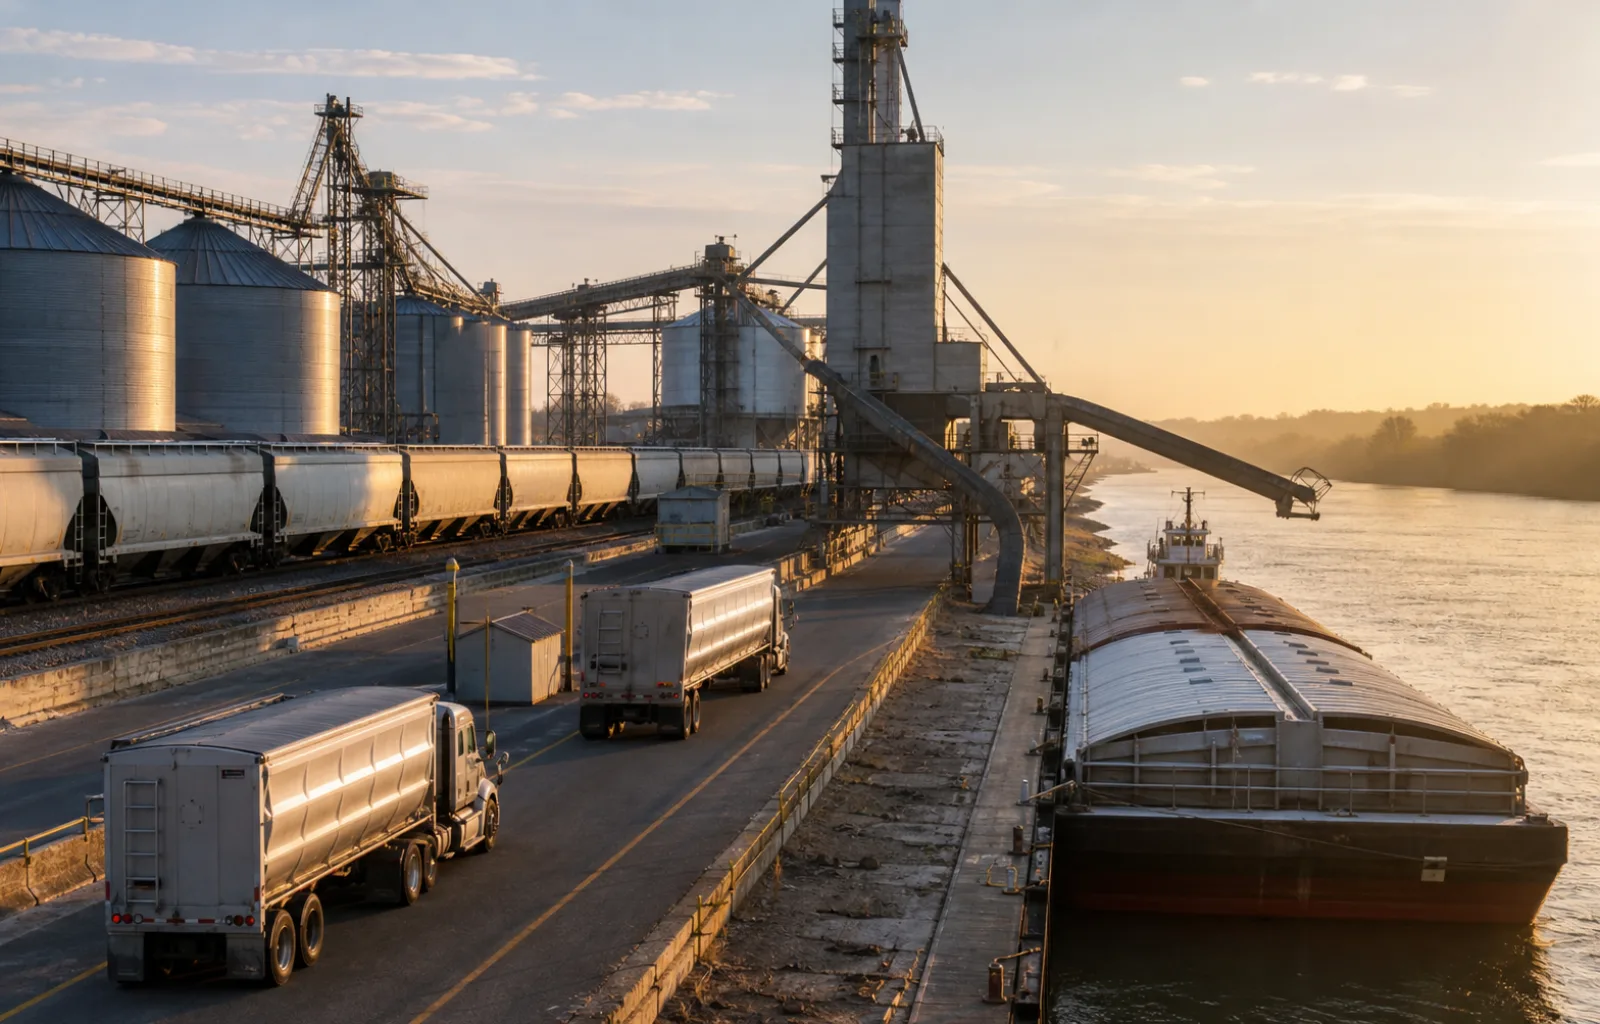
The cost of moving Upper Midwest grain toward Japan rose across every transportation leg in the second quarter, but the truck portion was not the largest mover. The U.S. Department of Agriculture's August 27 Grain Transportation Report put the modeled truck leg from Minneapolis at $18.71 per metric ton for both corn and soybeans, up 3.5% from a year earlier and 6.1% from the first quarter.
The full Gulf route increased much faster. USDA estimated total transportation cost at $135.00 per metric ton for corn and soybeans, about 33% above the second quarter of 2025. Within that route, barge cost rose 28% year over year to $47.02 and the ocean leg rose 49% to $69.27. The truck increase was real, but it accounted for less of the total change than the waterborne legs.

Pacific Northwest routing showed a different stack with the same direction. Total transportation cost reached $114.50 per metric ton for corn, up 13.8% from a year earlier, and $122.50 for soybeans, up 12.8%. The modeled rail leg rose 7.3% for corn and 6.4% for soybeans, while the ocean leg rose 33.7% for both commodities.
These are route models, not a national grain-hauling rate index. USDA combines published truck, rail, barge and ocean costs for grain moving from Minneapolis to Japan through the Gulf or Pacific Northwest. The figures do not state the number of truckloads, carrier margins, farm pickup radius, elevator wait time, backhaul value or rates on origins outside the modeled lane.
The market signal is still useful because it locates the pressure. FreightNews infers that a shipper facing a double-digit increase in total export transportation cost should not assign the whole change to the farm-to-elevator or elevator-to-terminal truck move. On the Gulf route especially, barge and ocean pricing changed the landed-cost deck more than the truck leg did.
For grain carriers, the defensible comparison starts with the portion they can quote and control. Separate loaded miles, empty repositioning, fuel, harvest wait time, washout, scale, seasonal labor and reload probability from the downstream rail, barge and vessel charges. A higher export-chain total can support a harder customer negotiation without proving that the truck rate itself moved by the same percentage.

Shippers and elevators should preserve the route alternatives rather than blend them into one average. The Gulf path carried a lower farm value for corn but a much larger year-over-year transportation increase; the Pacific Northwest path had higher rail and ocean costs but avoided the Gulf barge leg. Commodity, destination, vessel timing and inland origin determine which comparison is usable.
USDA also projected U.S. corn exports to fall 4% in marketing year 2026/27 while soybean exports rise 9%. Those forecasts are separate from the route-cost tables and can change. They do not guarantee fewer corn truckloads or more soybean loads in any region, but they are a reason to keep commodity exposure beside the cost forecast instead of treating all grain capacity as interchangeable.
For fall bids, price the truck move from actual lane evidence and use USDA's multimodal table as the customer context. The second-quarter message is not that trucking caused a 13% or 33% export-cost jump. It is that every leg became more expensive, while the biggest increases sat beyond the truck leg on the way to Japan.