
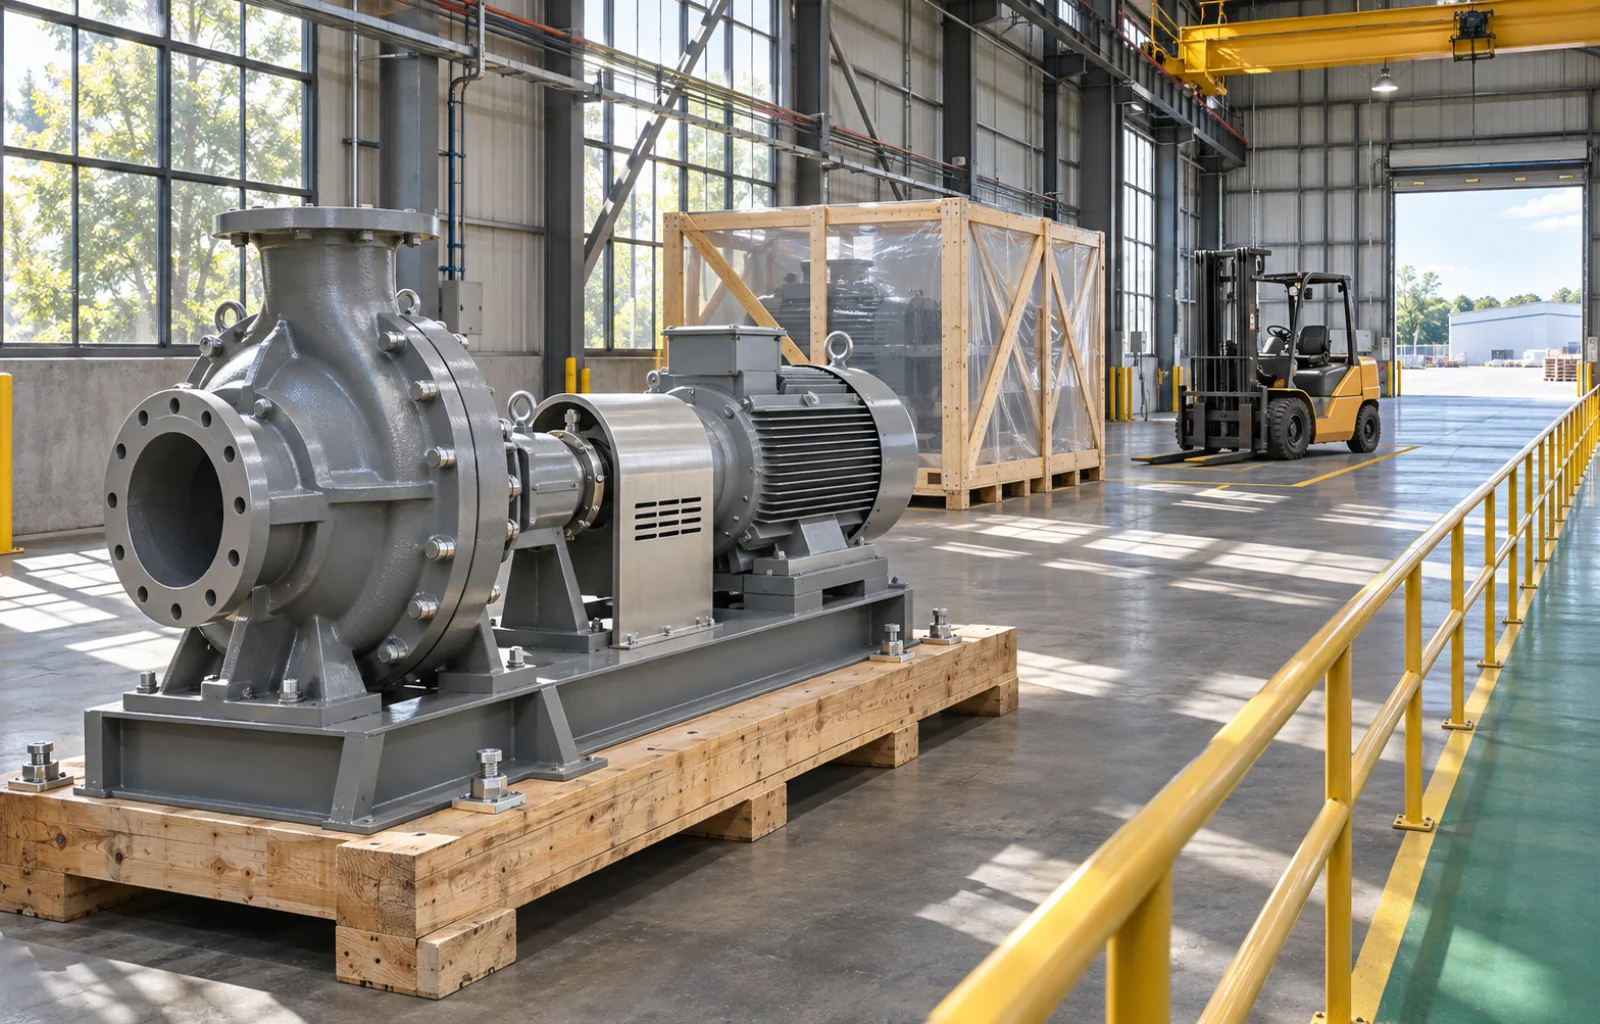

September’s machinery shipment gain gives equipment haulers a more selective sales lead than the national factory-orders headline. Industrial machinery and power-transmission equipment supplied most of the increase, while construction machinery barely advanced and metalworking machinery fell again. That is FreightNews’s analysis of the Census Bureau’s November 3 full manufacturing report, verified November 4. The question for carriers is which equipment customers actually have more machinery moving toward delivery.
Seasonally adjusted machinery shipments reached $44.807 billion, up $724 million from revised August. Industrial machinery increased $245 million to $5.336 billion, and turbines, generators and other power-transmission equipment rose $258 million to $5.838 billion. Together those two categories supplied $503 million, or about 69% of the machinery category’s net gain. This is a FreightNews calculation from Table 1, using published dollar levels; it does not establish their share of machinery truckloads.
The contrast is commercially useful. Construction machinery rose only $7 million to $4.597 billion, a reported 0.2% increase. Metalworking machinery declined $54 million to $2.930 billion, falling 1.8% after August’s 2.4% drop. A fleet whose machinery customers mainly make construction or metalworking equipment could therefore experience a different shipping calendar from a competitor serving industrial equipment or generators, even though both describe their business as machinery hauling.
The wider release provides context rather than a substitute for that customer detail. Total manufactured-goods shipments increased 1.3% to $668.5 billion, and new orders grew 1.8% to $677.2 billion. September machinery shipments rose 1.6%. All of these comparisons are adjusted for seasonality but remain in current dollars. A higher-value product mix or price change can raise shipment dollars without a matching increase in loads, weight or trailer utilization.
Census defines shipments around manufacturers’ net selling values, generally at the plant and excluding freight charges and excise taxes. The measure therefore does not report trucking revenue. It also cannot tell a carrier whether a machine moves assembled, in several components, through a distributor, or by a mode other than truck. Those distinctions determine the equipment, handling and route requirements that an aggregate sales value leaves unresolved.
FreightNews’s operating inference is to use the category split to prioritize conversations with existing and prospective shippers across the national equipment market. Ask industrial-equipment and power-equipment accounts about completed units, release dates and destination appointments. Ask construction and metalworking accounts whether their own schedules share the weaker national direction. Confirm dimensions, weights, loading arrangements and any site restrictions before treating a sales forecast as freight available for a particular trailer.
A more expensive machine can be attractive revenue for its manufacturer without improving a carrier’s round trip. Evaluate the actual loading window, unloading readiness, empty miles and return freight alongside the quoted haul. September’s table helps identify where to ask for that information; it supplies neither lane prices nor proof that specialist transport capacity has tightened. Pricing and positioning decisions still require an executable shipment plan.
Keep the November 3 release vintage with the account review. September estimates are preliminary and August is revised; the survey panel does not permit calculation of conventional sampling error. The useful follow-through is to compare the next release and the fleet’s accepted equipment loads with these separate machinery categories, then adjust the sales effort where customer delivery evidence supports it.